Exposing the potential of XAI-based causal discovery for analysing unstable rock slopes
1 Department of Environmental Sciences, Western Norway University of Applied Sciences, Sogndal, Norway
2 Department of Computer Science, Electrical Engineering and Mathematical Sciences, Western Norway University of Applied Sciences, Bergen, Norway
Geomatics, Natural Hazards and Risk · 2023
Abstract
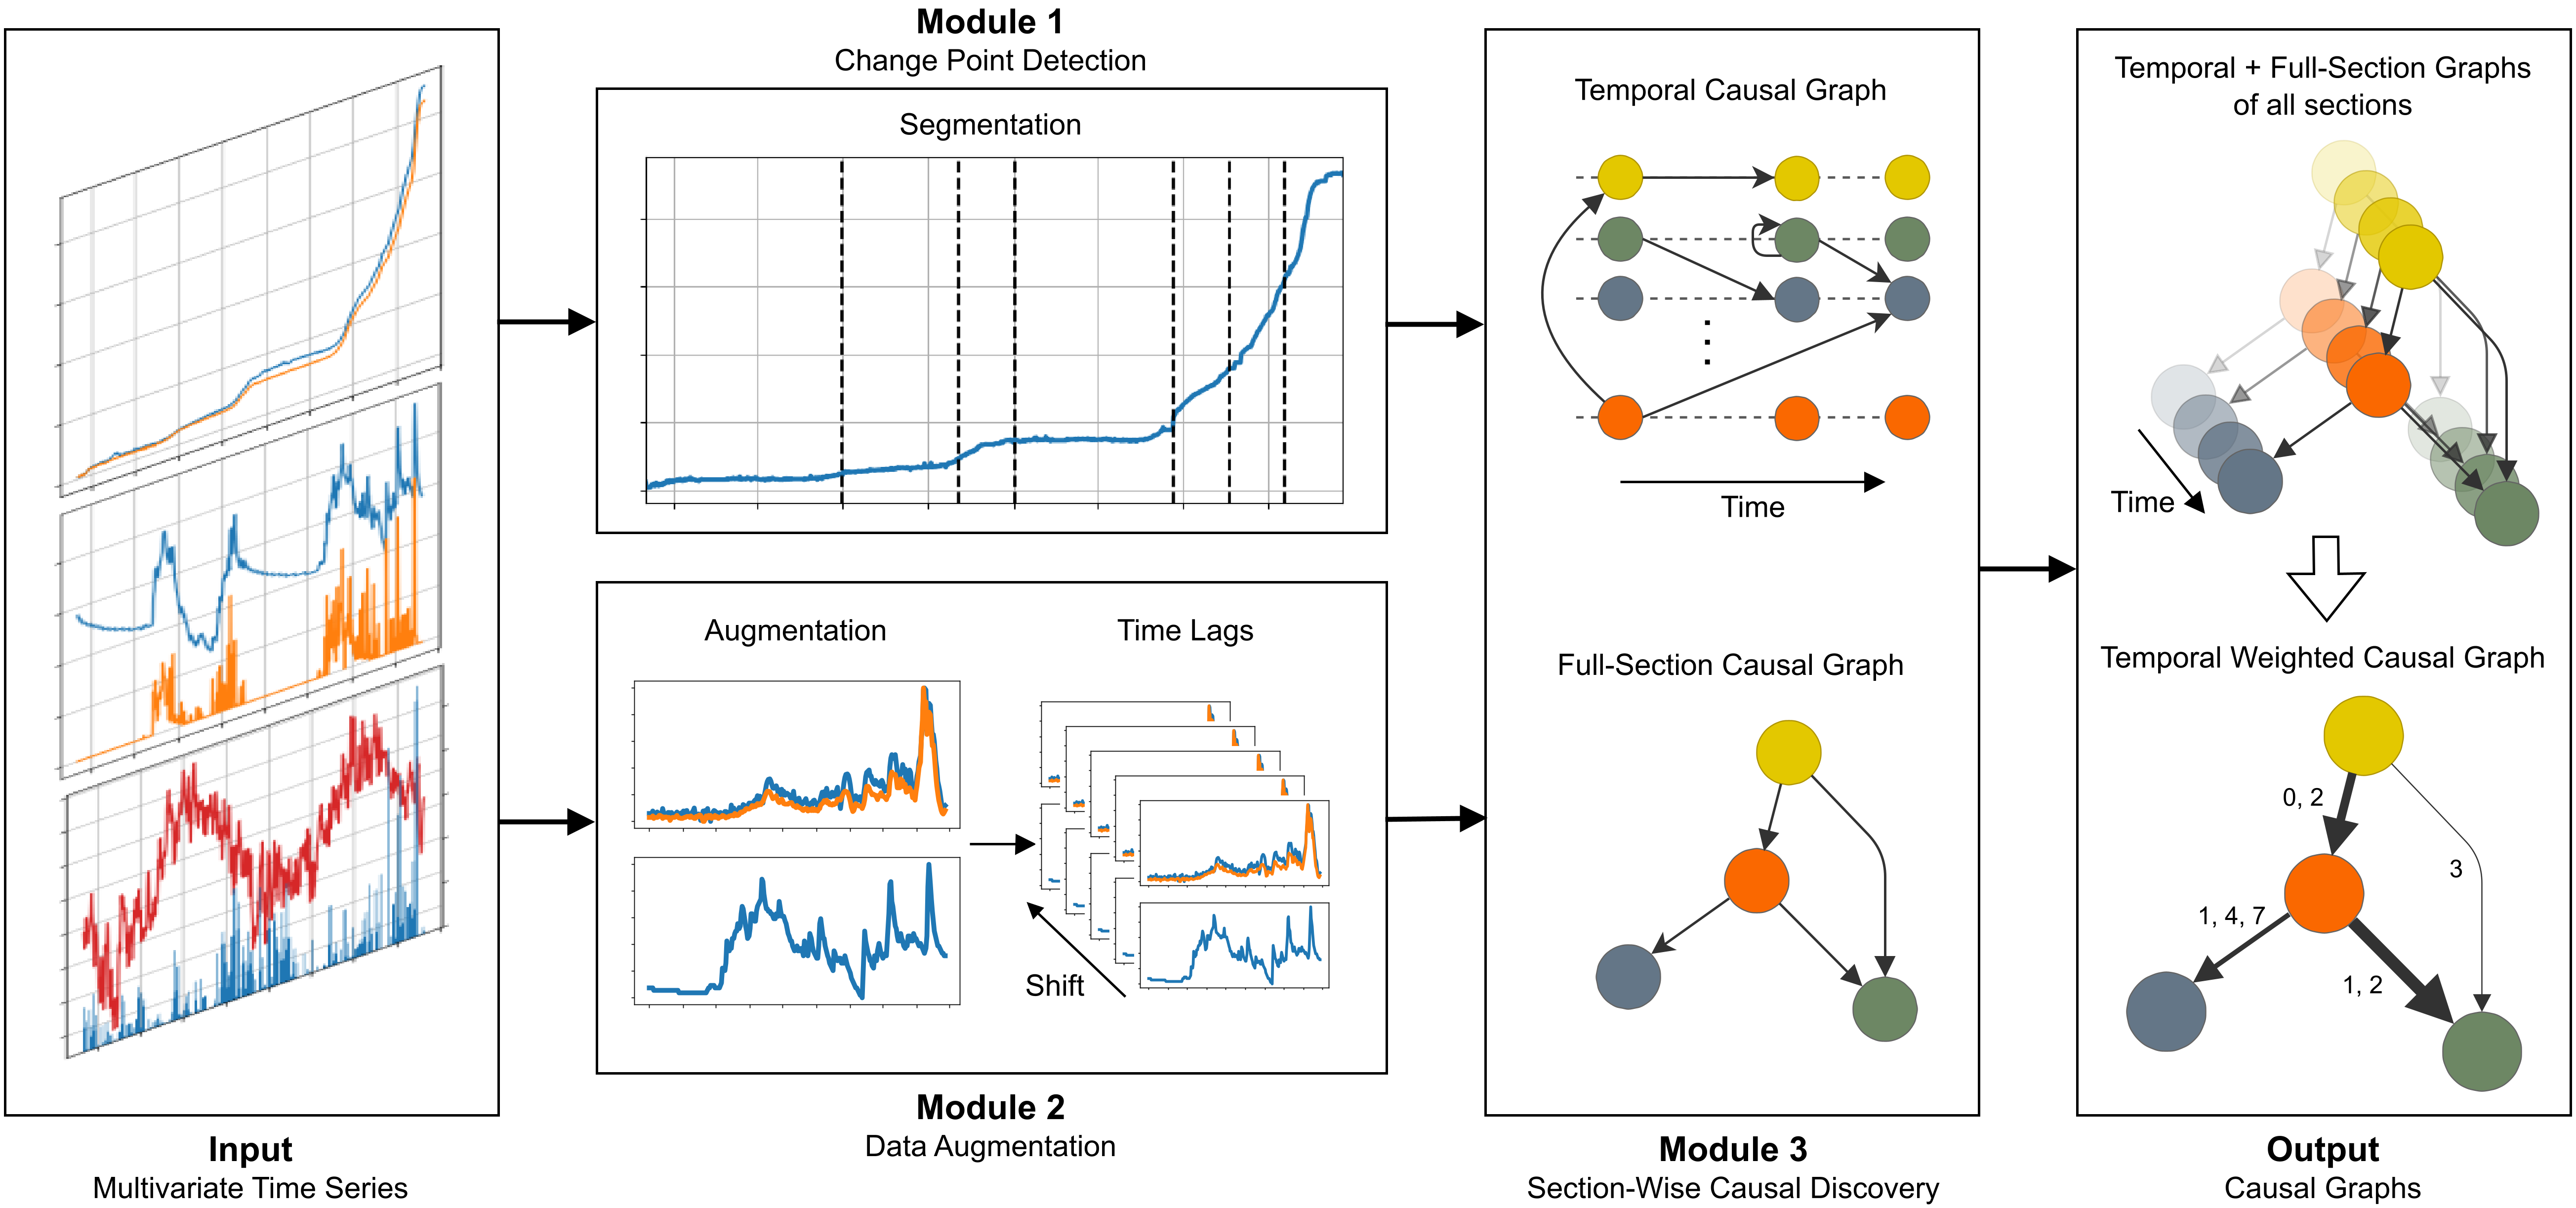
The idea begind the paper is to split a time series with non-stationary data into sections based on breaking points and then compute causal graphs in the separate sections. This will reveal changes in causal connections between different windows (sections in time). We showcase this to discover regime changes in displacement time series for unstable rock slopes. We also show that time lag information for the lag between cause and effect can be added to the causal graphs by providing time-lagged input of the variables in each window.
Background
The goal of this paper was to find a Causal Model of different variables on an unstable rock slope. This means that we would like to find, just by using monitoring data, what is driving the displacement on the slope. The input data can be measured displacement and environmental data, for example precipitation, temperature, soil water content and others. Based on these variables we would then like to find a Directed Acyclic Graph (DAG) with the variables as Nodes and the cause-effect-relations between them as Edges.
Key Ideas
- We devide a time series of a "target" variable into sections using breakpoints, finding points where the underlying sample distribution changes. We are using Pruned Exact Linear Time (PELT) which finds an unknown number of change points by minimising a cost function.
- In the different windows, based on the breakpoints, we find causal relations between the variables, including time-lagged connections, using DAG-GNN, a generative model based on a Variational Auto-Encoder, which learns the underlying sample disrtribution in the window.
- Visualising the causal graph gives important insights into the evolution of the variables and their relations to each other.
- We propose the framework as a support tool for montoring unstable rock slopes.
Application
Figure 1 illustrates the application setup: Sensor network on a rock section where displacement is being monitored along with precipitation, temperature, soil moisture and infiltration of water into the ground.
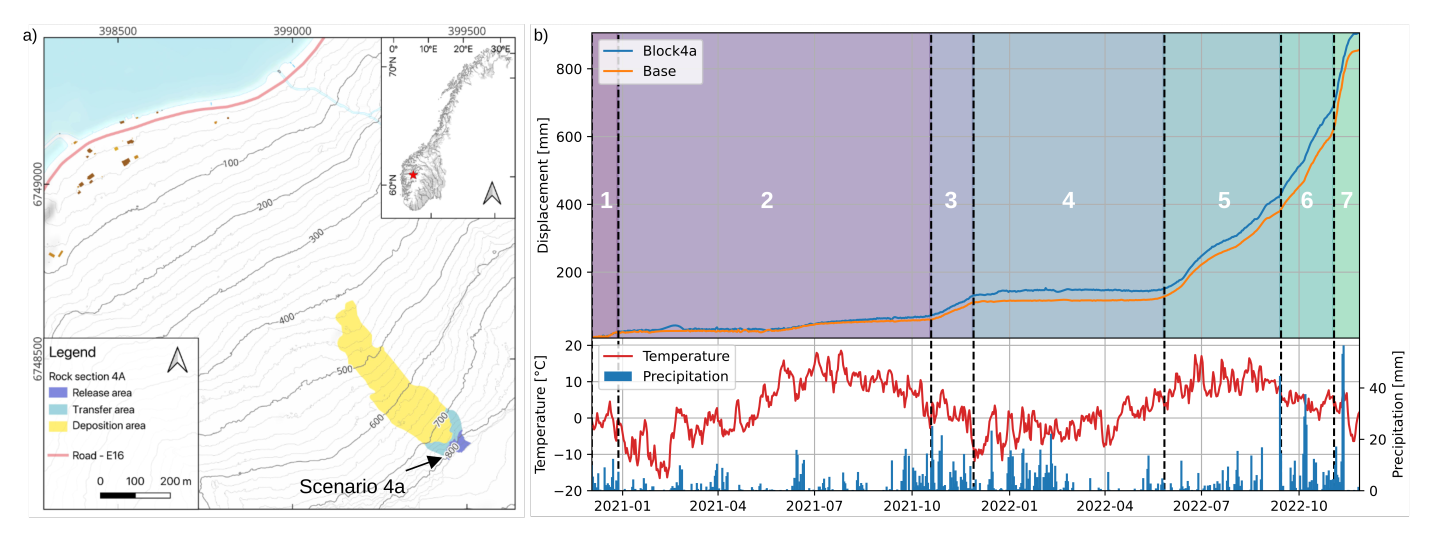
Figure 2 shows the graph output when the framework is applied to the data from rock section 4a.
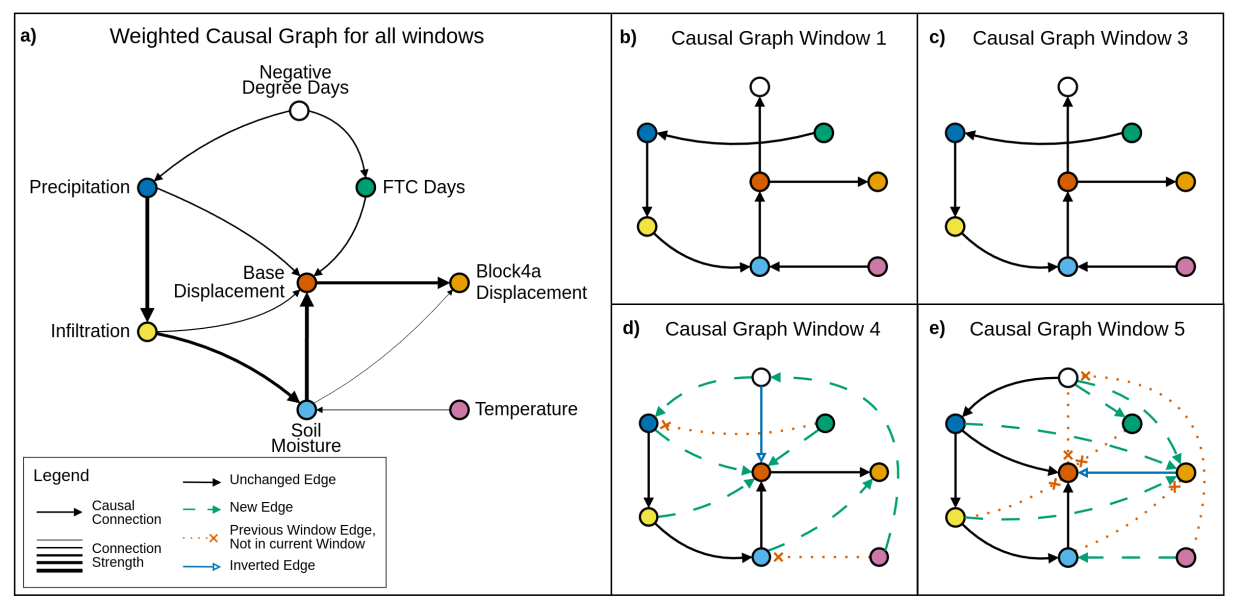
We can observe that the displacement acceleration in window 5 for example comes with a significant change in connections in the causal graph.
Conculsion
Using the generated summary graphs and looking at the temporal evolution of the interaction between variables can grant valuable insights into slope evolution. We use it in the publication to reveal regime shifts and changes in spatial and temporal relations over time as well as overview graphs that summarise the slope behaviour over the whole observation period. These insights can be used to select features for Machine Learning tasks or to inform imputation methods to fill missing data in the sensor network.
Citation
@article{Schild2026,
    author={Schild, Lukas
        and Scheiber, Thomas
        and Snook, Paula
        and Maschler, Alexander
        and Arghandeh, Reza
    },
    title={Exposing the potential of XAI-based causal discovery for analysing unstable rock slopes},
    journal={Scientific Reports},
    year={2026},
    month={Apr},
    day={24},
    issn={2045-2322},
    doi={10.1038/s41598-026-48268-x},
    url={https://doi.org/10.1038/s41598-026-48268-x}
}